It can be tough for students to stay focused in an online learning course. Often e-Learning is a just a simple remediation of textbooks -- the dreaded "page-turner" that can dissolve even the strongest motivation with each monotonous click.
At iBiology Courses, we keep working to create engaging learning experiences that keep you motivated. When developing each course we work really hard to bring you engaging videos with expert speakers and robust community discussion with peers, in addition to the essential written content. Furthermore, we ensure that each course will tranform your work into a personalized artifact that remains useful long after the course is complete.
As part of that effort, we've recently created two new interactive assessments as part of an upcoming course "Build Your Research Community" (BYRC). These two new tools -- TableTool and DiagramTool -- allow the course designers to create interactions that engage students with more than a simple text entry field.
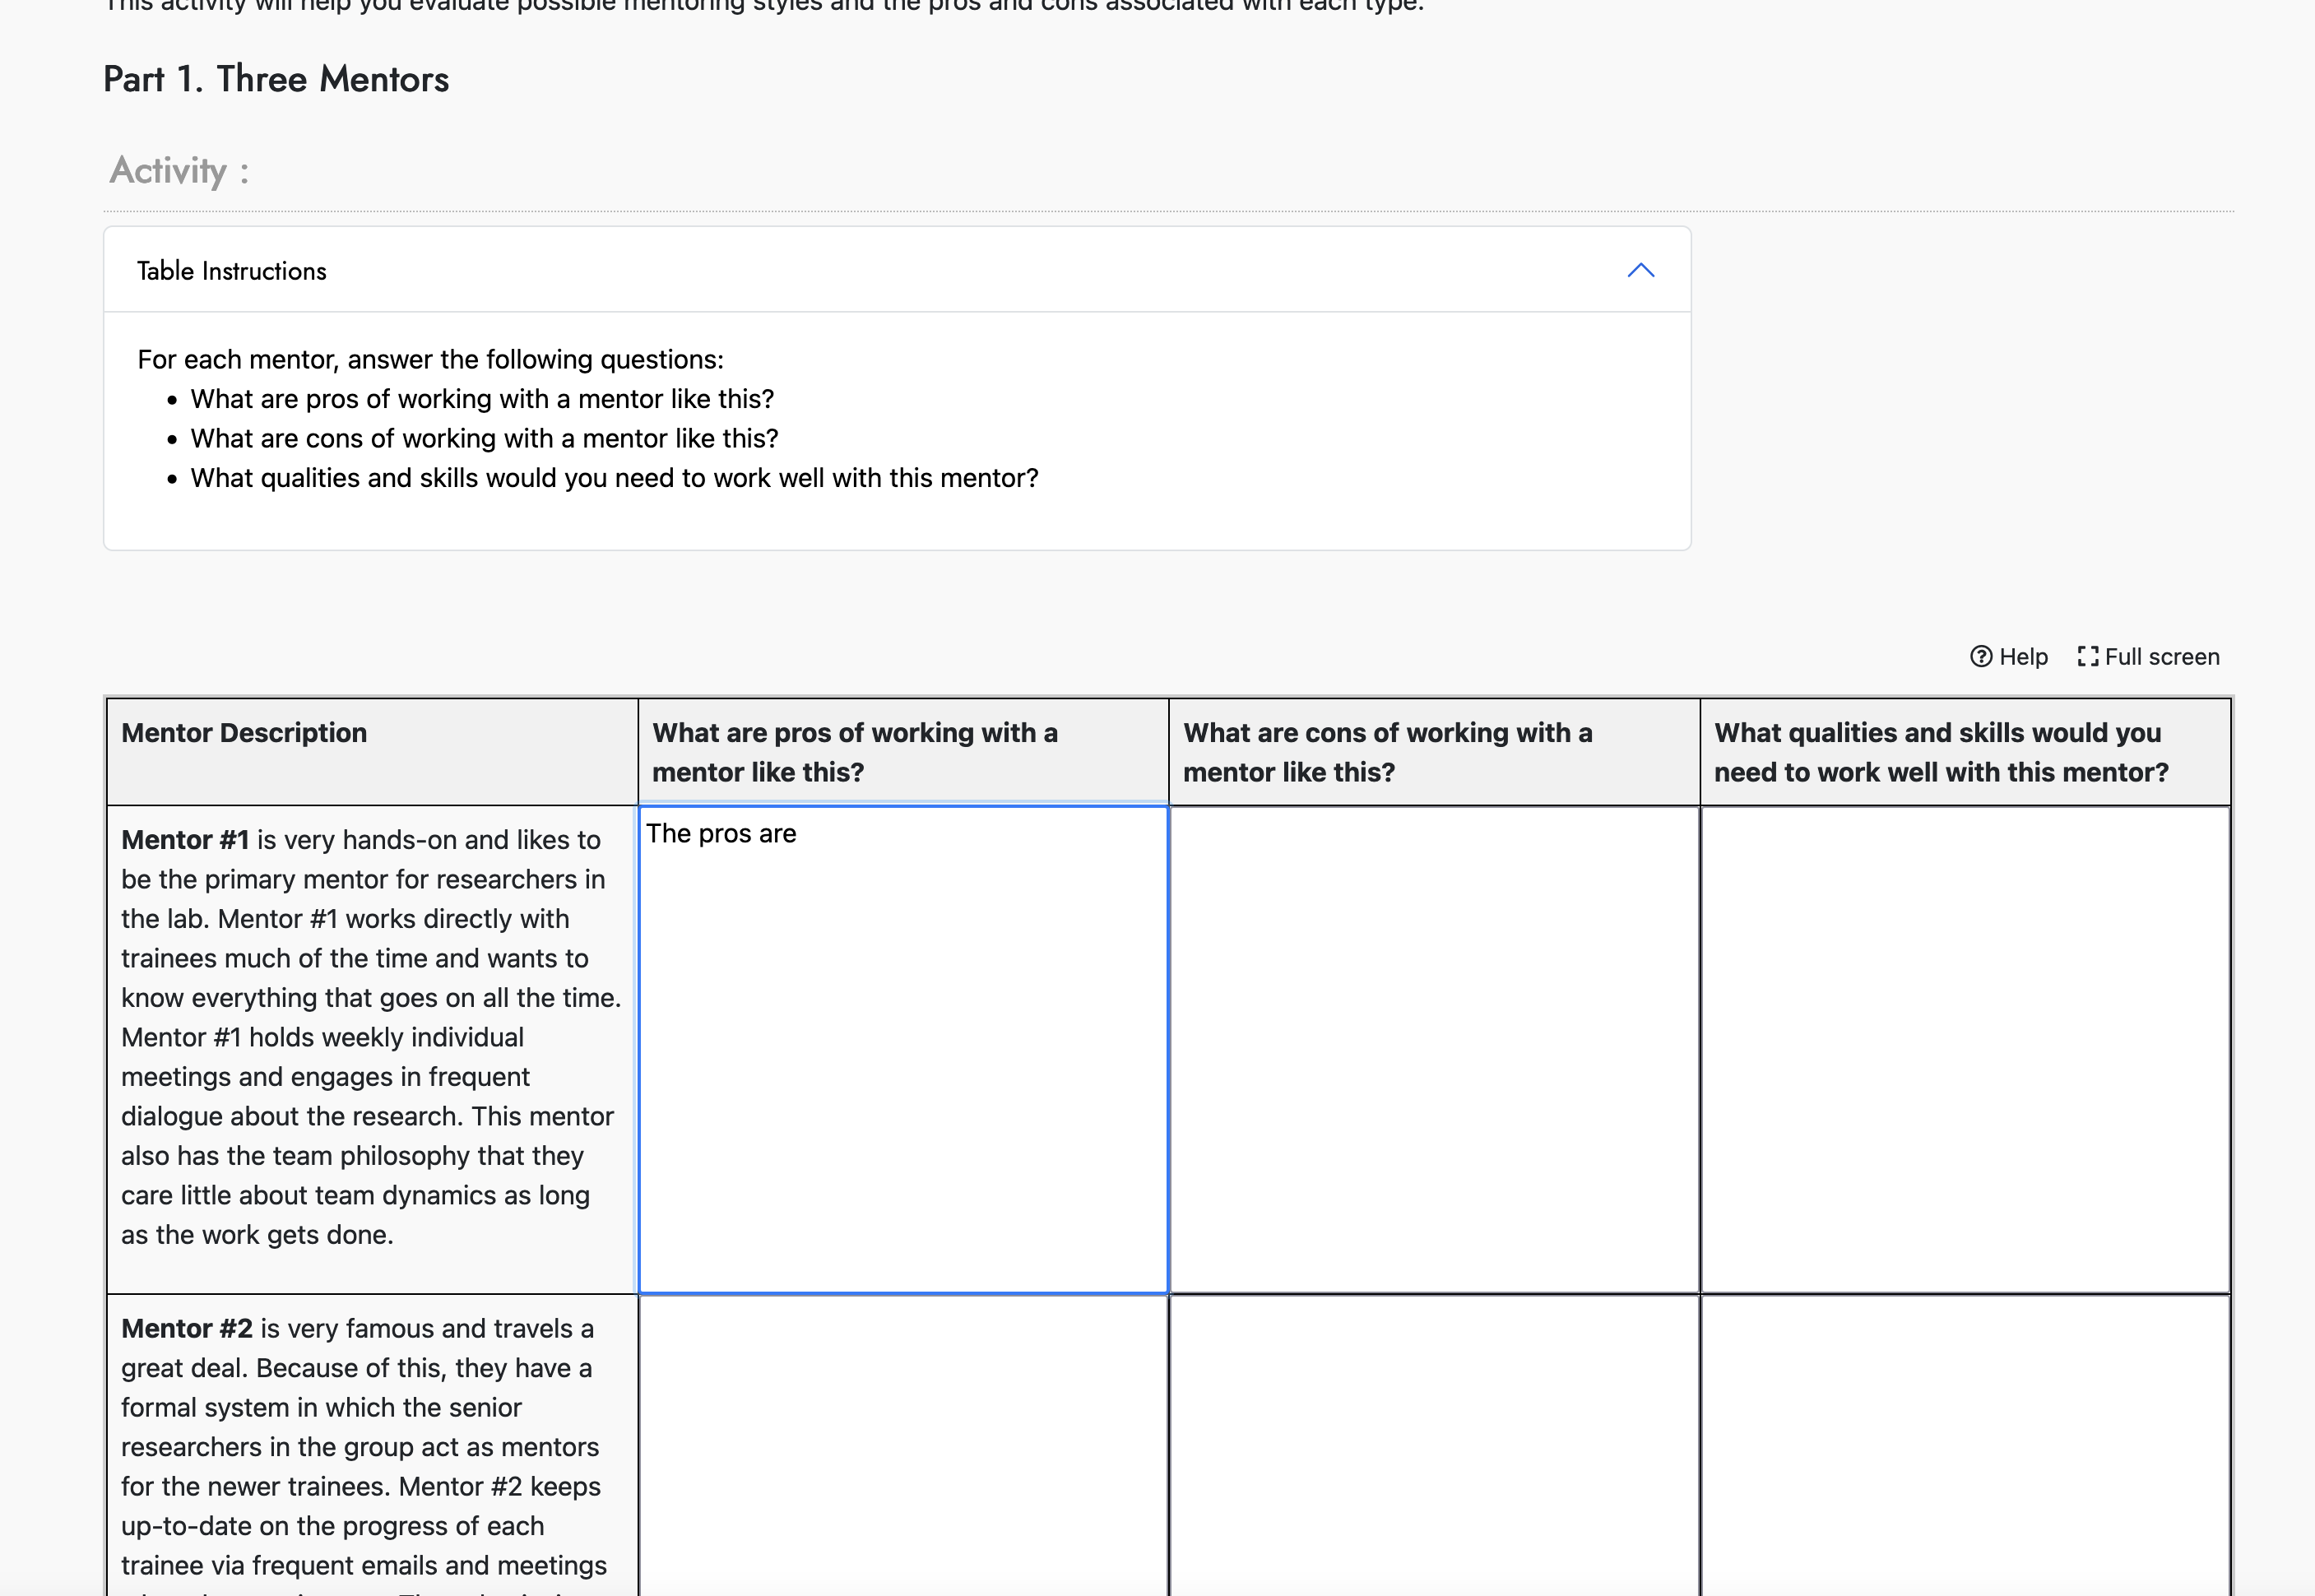
Tabletool allows us to quickly create a wide variety of table-based activies, with editable cells and rows that can be added and deleted. In BYRC, students use these tables to formulate plans for extending their mentor network. In the activity below, BYRC students are asked to develop pros and cons for different types of mentors.

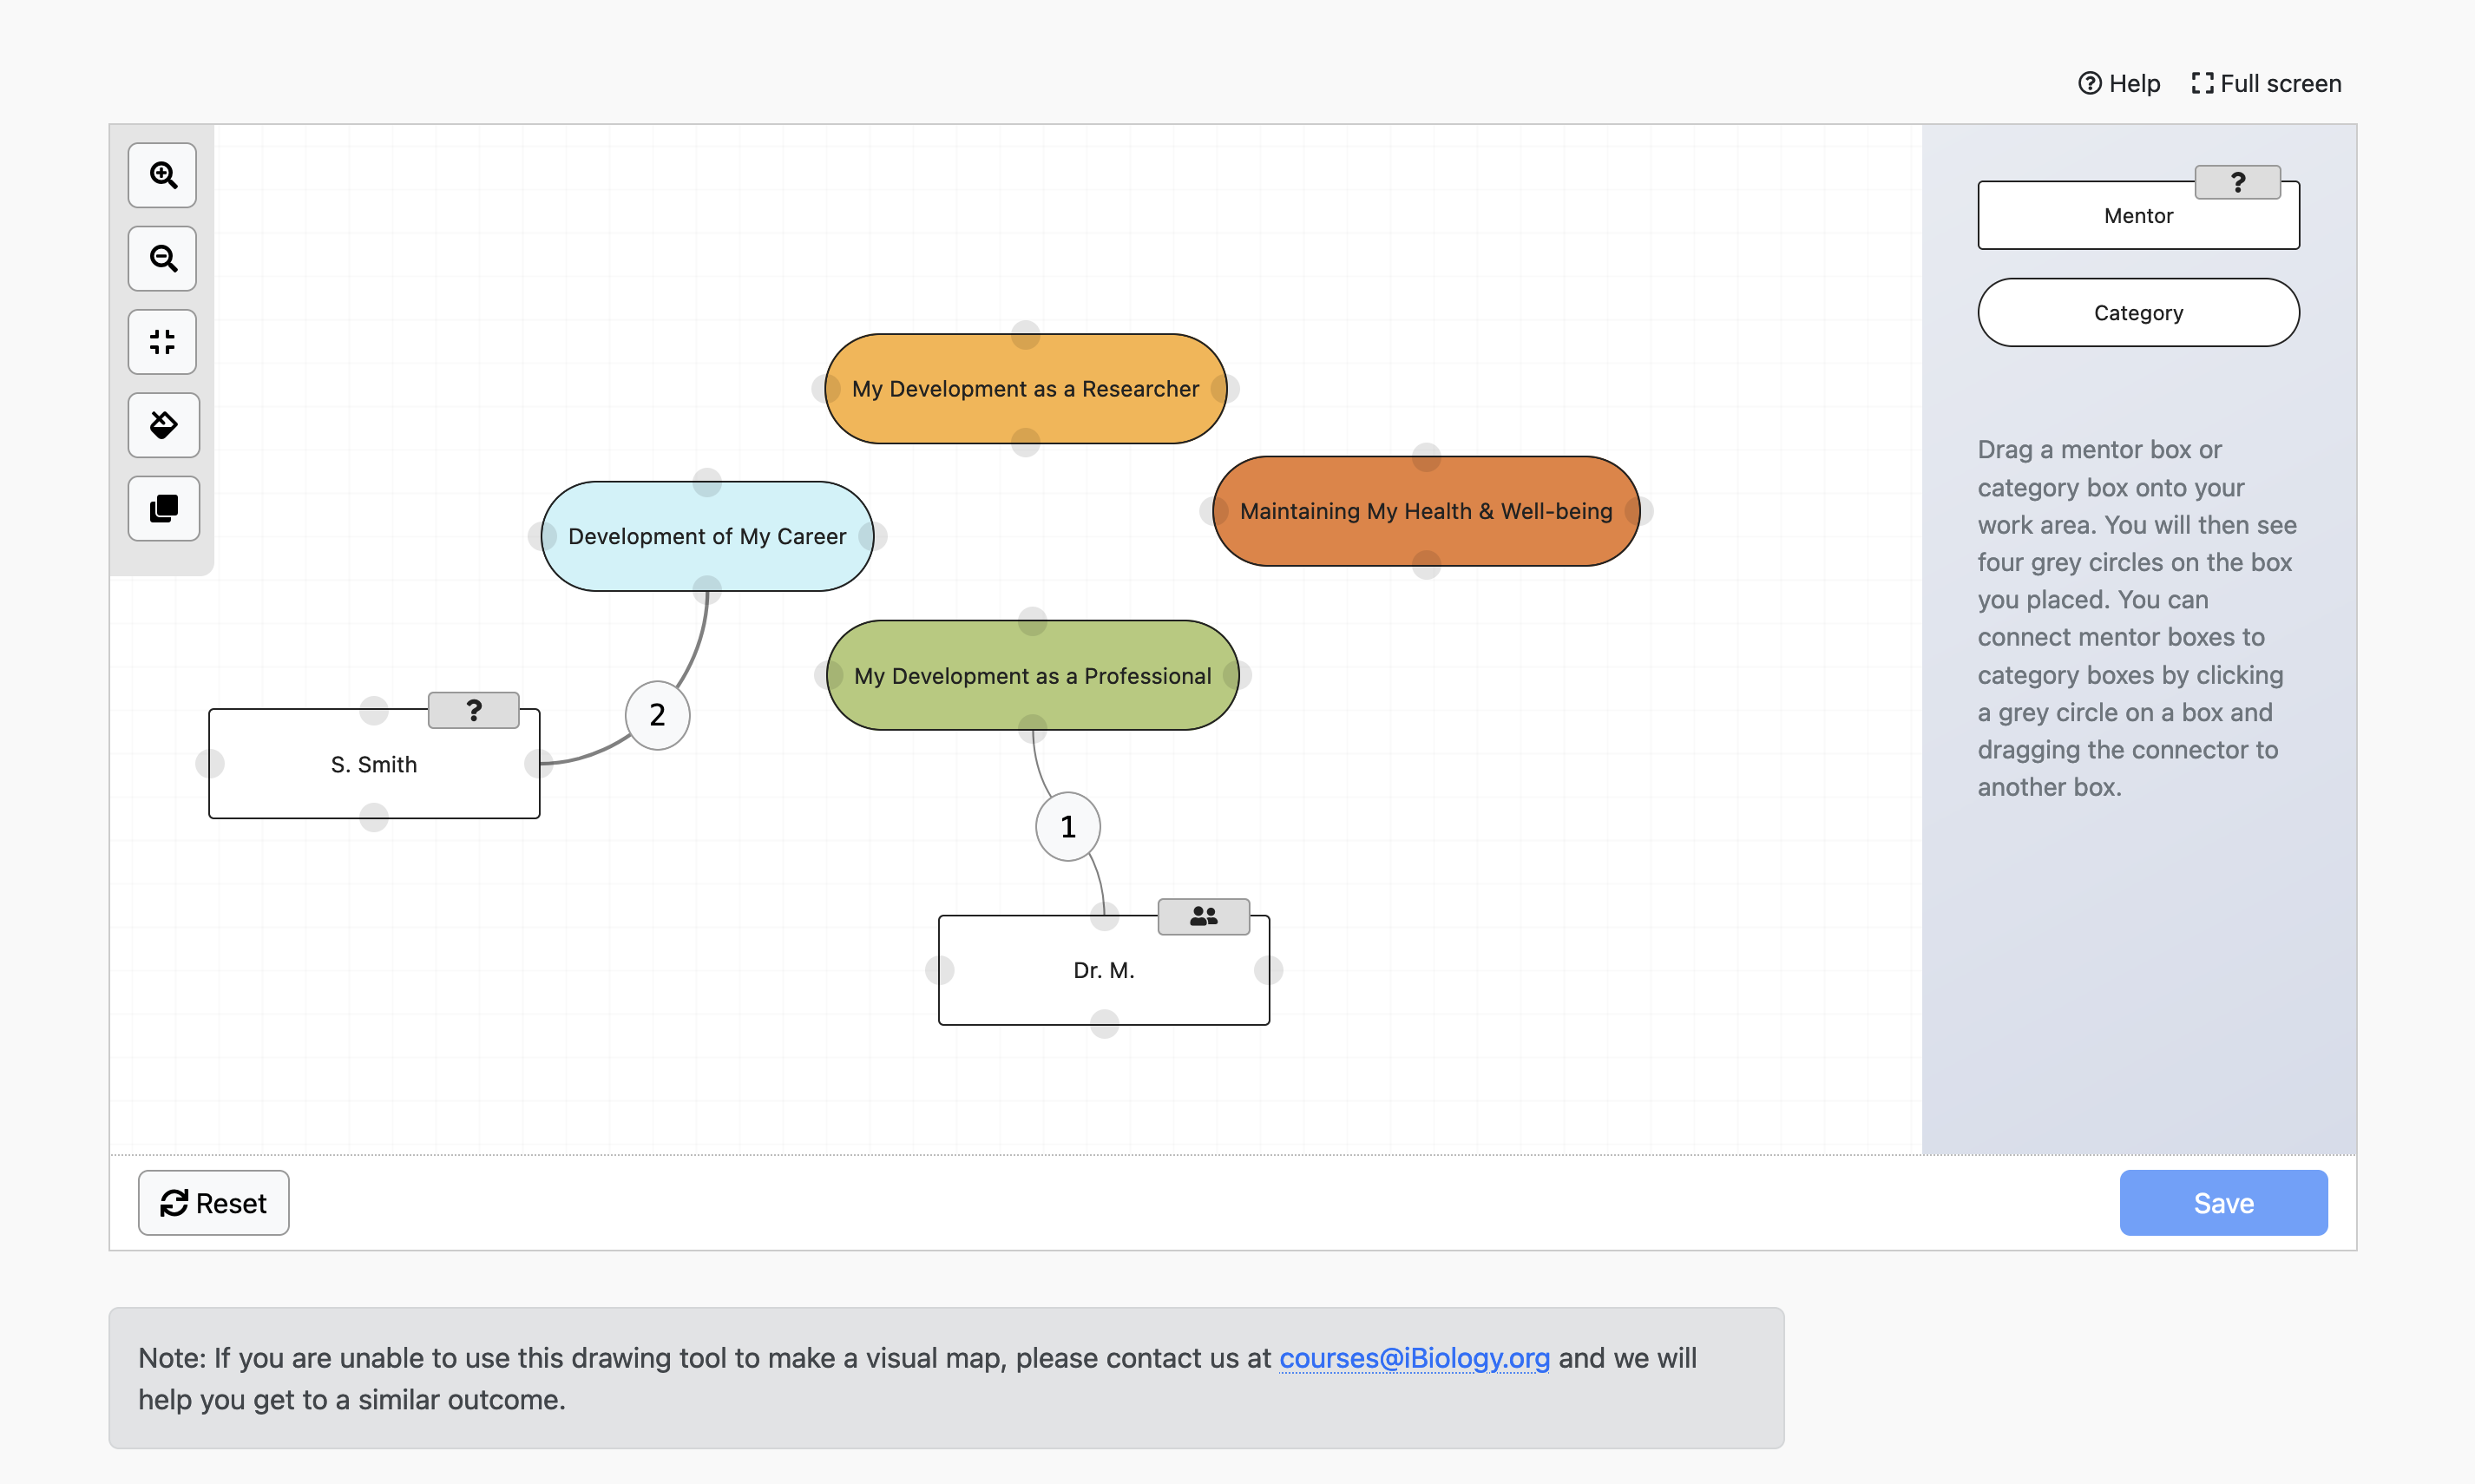
With DiagramTool, course designers can create interactions that ask students to build a node edge diagram or other visualization. In the example below, BYRC students are tasked with creating a visual map of their mentor network.

Revolutionary? Probably not. But TableTool and DiagramTool give course designers two new ways to frame questions in a new context and make gathering information and formulating thoughts more suited to an interactive environment. Now that we've made a technical base with these two tools, our intention is to add more interesting and engaging interactions in the future. Watch this space!
